One of the key pieces of information for any business is - what is your break-even point?
This is the point of sales volume or revenue, that is required to cover all your costs, being both fixed costs as well as variable costs. At this break-even point your total profit is nil. Before you reach that break even point, you will be making losses. After that break even point, you will be making profits.
In order to generate sales, you have to incur costs. You need to know how much you must sell in order to break-even.
You can get our free break-even point calculator here. It is an Excel spreadsheet that you can use to calculate your break-even point.
So, how do you calculate your break-even point?
First we need to understand what our total costs are made up of.
Your costs are made up of fixed costs and variable costs.
Fixed costs are those costs which do not change with the volume of sales. For example, costs like rents or administrative salaries do not vary with the number of units of product sold. Other fixed costs might include advertising, accounting and legal fees, business registrations, even power and water unless these are used in the manufacture of your product.
Variable costs are expenses that vary according to the volume of production or sales. These will include costs such as cost of goods or manufacturing costs, raw materials, freight, packaging, and so on. Variable costs may even include some wage costs - for example wages of workers directly involved in producing your goods or services and who are paid in relation to their activity rather than at a set rate.
Often, deciding whether a cost is fixed or variable is a matter of judgement, especially where some seem to be a combination of both types of costs. When you are analysing your costs, you will have to make a judgement, depending on how much the cost is affected by volume and activity.
Knowing your break-even point means that you know how much you must sell at a given selling price in order to cover all your fixed and variable costs.
This can be demonstrated in a graph.
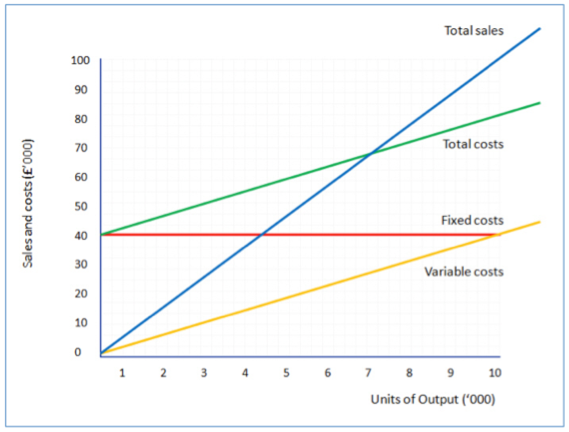
The red line is fixed costs, in this case $40,000 - whatever the unit of output, it doesn't change.
The yellow line is variable cost moving from $0 at 0 units output, to $20,000 at about 6,000 units of output, to $40,000 at 10,000 units of output.
The green line is the total cost - adding together the values of the red and yellow lines.
The blue line is sales at different levels of output.
In this example you can see that the break-even point is where the blue line crosses the green line at about 7,000 units of output.
If you sell more than 7,000 units, you make a profit (calculated as the difference between the blue line and the green line).
If you sell less than 7,000 units, you make a loss (calculated as the drop from the green line to the blue line.
You can calculate your break-even point as the number of units you need to sell in order to break even, or as the amount of revenue you have to make.
The calculation of the break-even point in number of units follows the formula:-
- Fixed costs divided by (Price Per Unit-Variable Cost Per unit)
For example, say your total Fixed Costs per annum were $200,000 and your selling price per unit of your product was $12.50; and the variable cost per product was $5.80.
- 200,000 / (12.50-5.80) = 29,850.75 units required to break even
Then, the amount of revenue required to break even is 29,850.75 units x $12.50 per unit or $373,134.33
Armed with this information you know that you have to sell 29,851 units (or $373,135 in sales) in order to start making a profit. Knowing this you can:-
- Market with the objective of selling more than the break even; or
- Attempt to reduce fixed costs or variable costs in order to bring down the break-even point.
In our free Excel spreadsheet Break-Even Calculator which you can download here, we have set out the formula for you so that all you need to enter are your figures for fixed costs, selling price and variable costs.
In the first section of the free download, you can just enter your selling price per unit, variable cost per unit, and fixed cost per annum. The calculator will calculate and report the units you need to sell to break even and the revenue you need to make in sales.
If you don't know what your variable cost per unit is, the calculator also provides you with a quick estimator to find that value. All you will need is your selling price per unit, and a copy of last year's profit and loss account and extract from that the total sales and the total cost of goods sold, insert those into the calculator and it will give you an estimate of the variable cost per unit.
Finally in the second half of our free calculator, we give you an alternative way for you to calculate your break-even point.
This method provides an estimate of your break-even sales revenue if you are unable to dive into unit prices and costs (for example if you sell multiple products and services). All you will need is a set of accounts and obtain from that your total sales, and, in total - the variable costs and the fixed costs.
You can download your free copy of the calculator here.
Don't forget, if you need our help to calculate your break-even point, you can go to the "Contact Us" link in our website www.otsmanagement.com.au or call us on 08 9242 2085
Please feel free to comment in the comments area below if you need any help using the calculator, or go over to our Facebook page at https://www.facebook.com/otsmanagement